


The TMUA is scored on a scale of 1.0 to 9.0, with each candidate’s raw number of correct answers (out of 40) converted to this scaled score according on the difficulty of the questions they answered.
If you’re applying to a university which requires the TMUA, you’ll want to know what TMUA score to aim for to improve your chances of acceptance.
In this guide, we’ll explain in detail how TMUA scoring works, including the score conversion process and grade boundaries. We’ll also analyse the official score data for the last three application cycles, and look at what score you need for universities like Cambridge, LSE, Imperial, and Oxford.
How Does TMUA Scoring Work?
The TMUA consists of two papers, each containing twenty questions. Students receive marks for every right answer with no penalty for wrong answers.
Your raw score, based on the number of right answers you give, is then converted into a score on a scale of 1.0 to 9.0, where 1.0 is lowest and 9.0 highest. According to the TMUA annual report, this process is carried out using a statistical method called the Rasch item-response model.
The key to understanding this is that all students do not take the exact same test, even in the same testing window. The examiners write more questions than are contained in one test, and different students will be given a different set of questions (though there is often still a lot of overlap).
Because one set of questions may be slightly easier or harder than another, it would be unfair just to go on raw scores alone. The Rasch item-response model adjusts the scores according to the difficulty of the test each student took, so that if two students got the same raw score, the one who had taken the harder version of the test would get the higher scaled score.
In 2024, UAT-UK took over the administration of the TMUA and changed the scaling system. In the two test cycles since then (2024-25 and 2025-26), they have set the scaling so that the median candidate in the October window gets 4.5 and the 90th percentile candidate in the October window gets 7.0.
TMUA Score Distributions
In this section, we will explore the TMUA score data for the two most recent test cycles, 2025-26 and 2024-25.
2025-26
The chart below shows the percentage of candidates who achieved each TMUA score in the 2025-26 test cycle. It is based on official TMUA data.
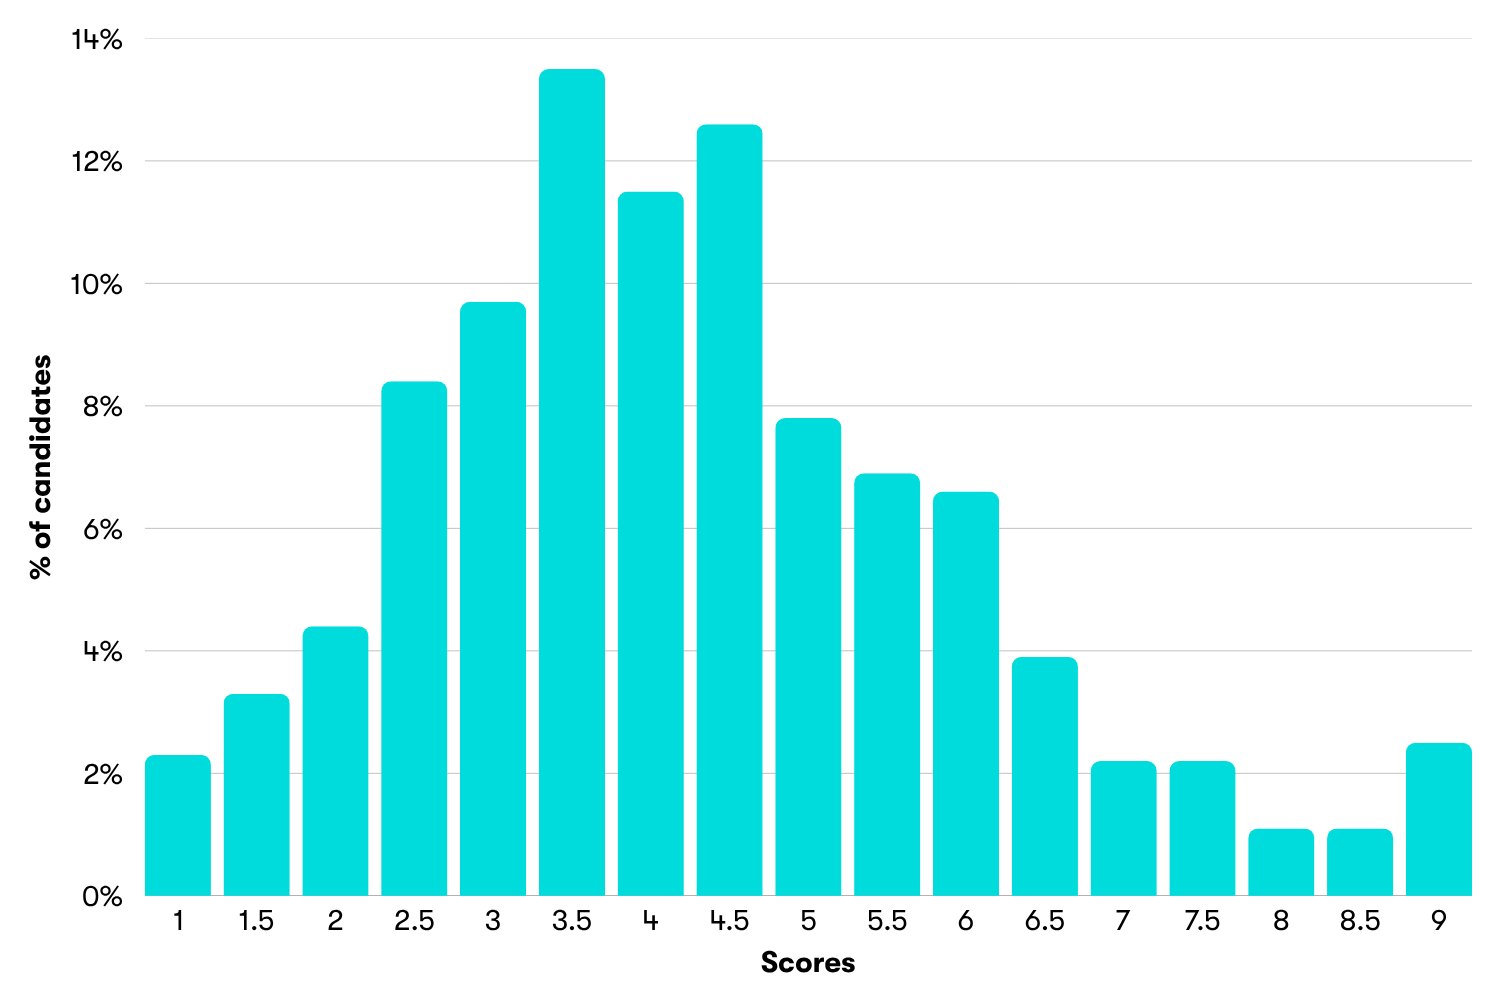
We can see that scores cluster between 3 and 5, with 55% of candidates achieving a score in that range. The most common scores are 3.5 (13.5% of candidates) and 4.5 (12.6% of candidates).
Only 9.1% of candidates achieve a score of above 7.0, with 2.5% achieving a perfect 9.0.
2024-25
The chart below, based on official TMUA data, shows the score distributions for the 2024-25 test cycle.
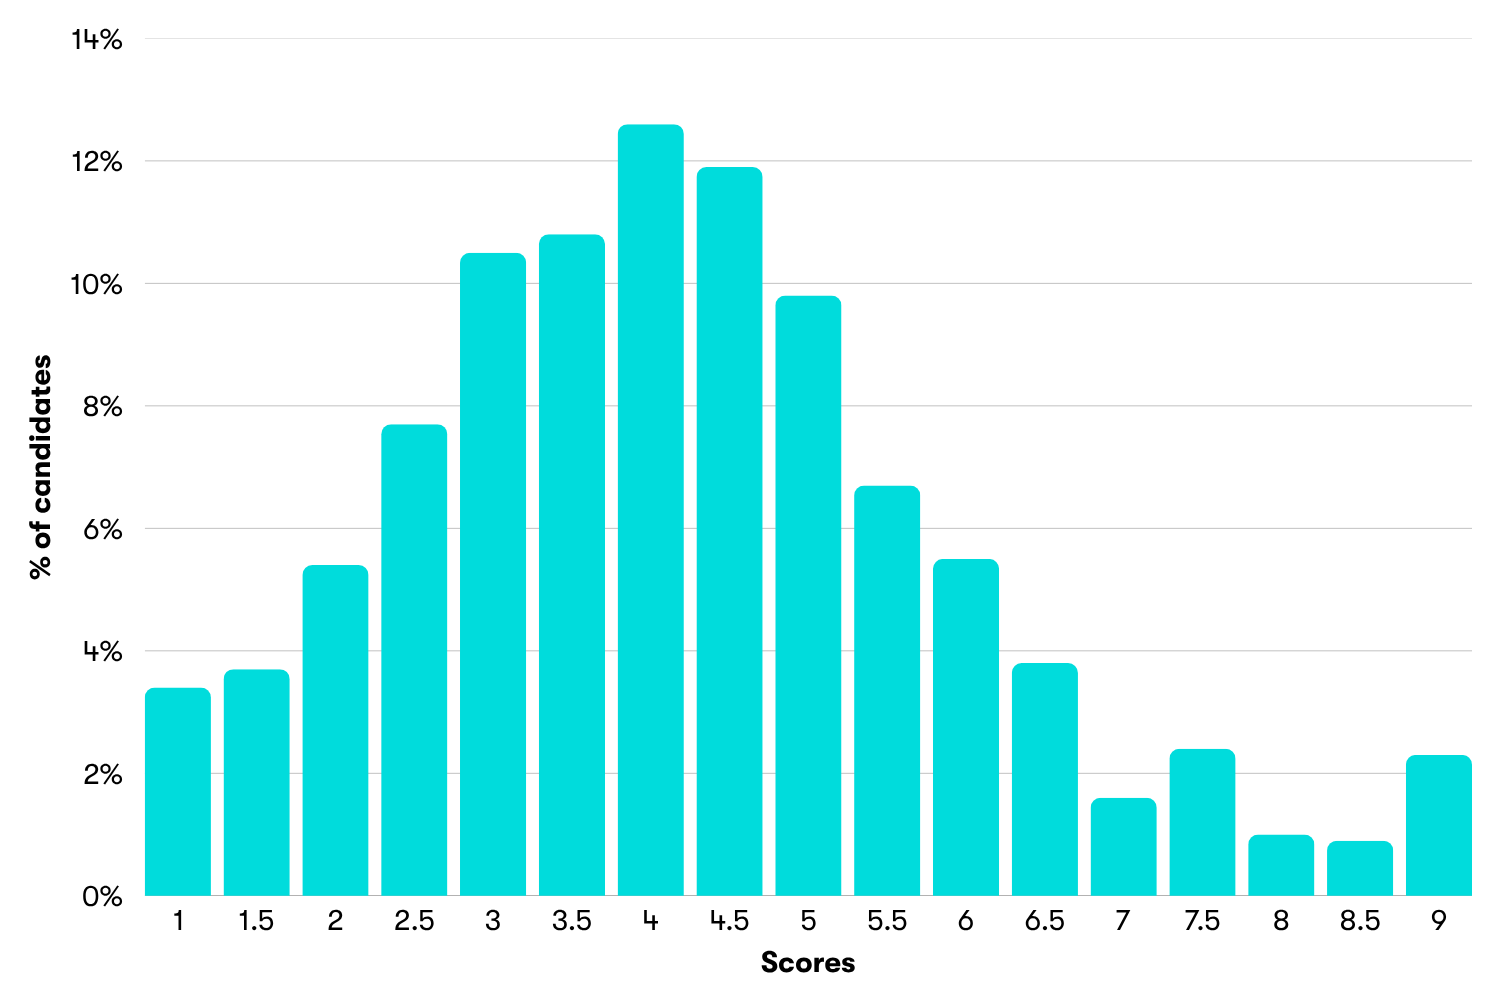
As in 2025-26, most candidates clustered between 3 and 5. 56% of candidate scored in this range (vs 55% in 2025-26).
Even fewer candidates achieved a score above 7.0 – just 8.2% in 2024-25, and a mere 2.3% got a perfect TMUA score of 9.0.
Score Percentiles
This table shows the TMUA score percentiles for 2024-25:
| Sitting | Number of Test-Takers | 25th Percentile | 50th Percentile | 75th Percentile | 90th Percentile |
| Oct 2024 | 8,987 | 3.3 | 4.5 | 5.7 | 7.0 |
| Jan 2025 | 4,868 | 2.4 | 3.3 | 4.4 | 5.4 |
| All | 13,855 | 2.9 | 4.0 | 5.2 | 6.5 |
As noted above, since 2024, the 50th and 90th percentiles have been fixed to scaled scores of 4.5 and 7.0 respectively in the October sitting.
However, the overall 50th percentile score is 4.0 and 90th percentile score is 6.5. This is because the average is dragged down by the January sitting, where candidates perform worse on average. This is to be expected as Cambridge applicants, many of whom are likely to be among the strongest candidates, are required to take the test in October.
2024-25 vs 2025-26 Comparison
This chart shows the cumulative percentage of candidates achieving each TMUA score in 2024-25 and 2025-26.
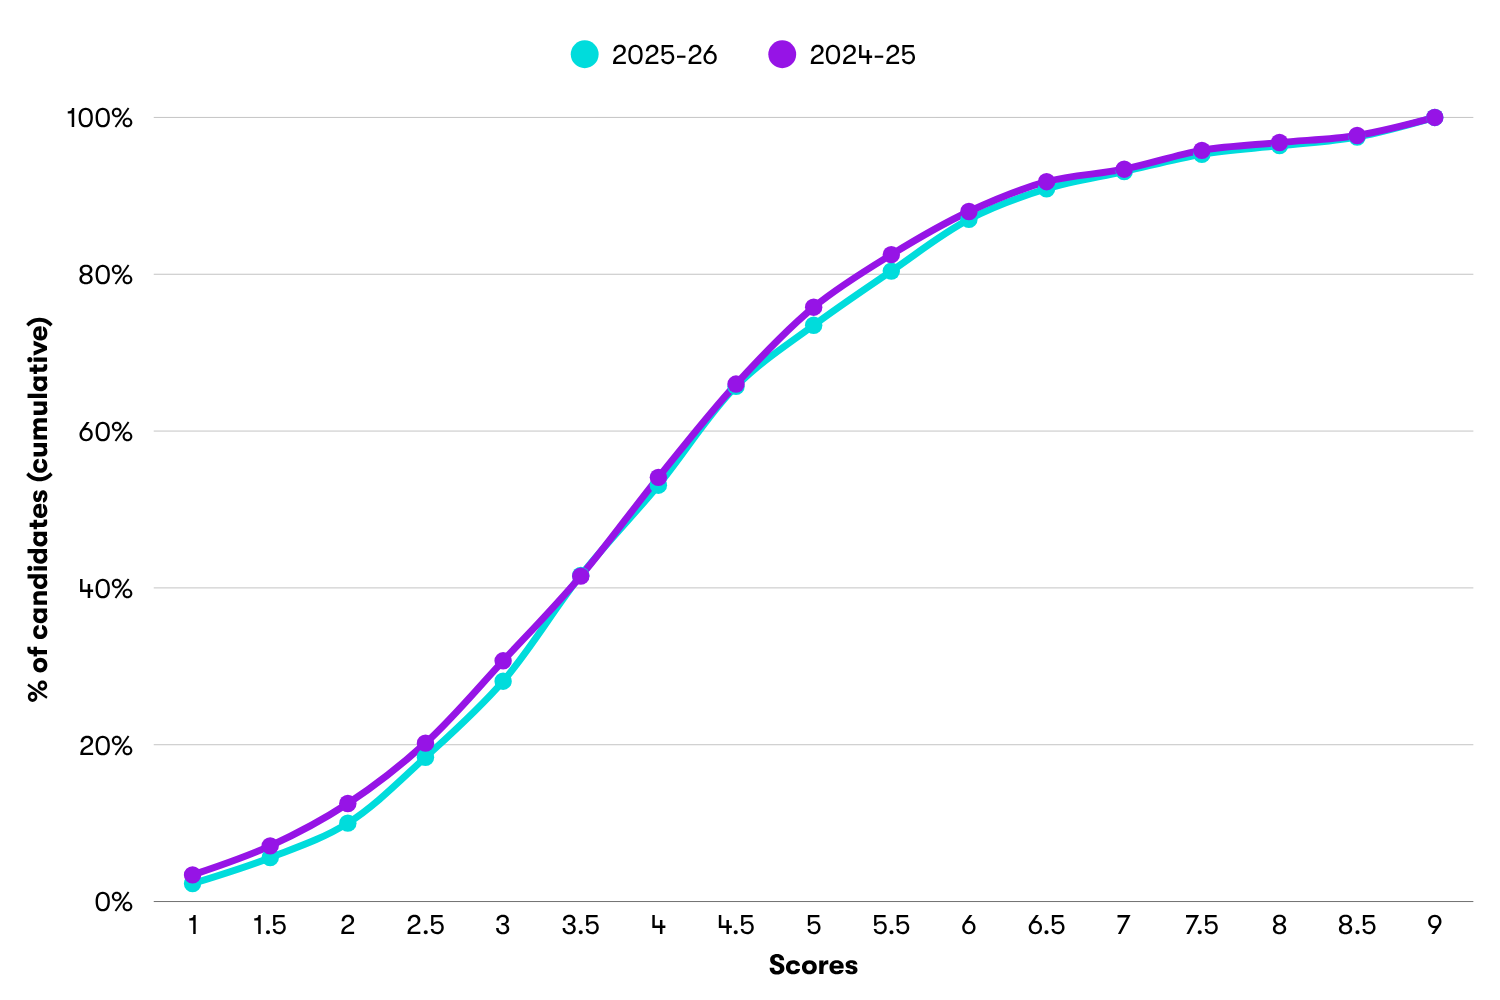
As we can see, the 2024-25 line is slightly higher than the 2025-6 line until around the 6.5 mark. This shows that more candidates got scores below 6.5 in 2024-25 than in 2025-26 – in other words, the candidates in 2025-26 did slightly better on average. This reinforces the point made above, that 9.1% of test takers scored 7.0 or better in 2025-26 vs 8.2% in 2024-25.
TMUA Tutors
Our students improve their admissions test scores by 20% after just four hours of tutoring.
TMUA Score Conversion
Since 2024, when UAT-UK took over the administration of the test, no official TMUA score conversion tables have been published. This is because the new scaling model factors in the difficulty of the questions to the scaled score, making straightforward conversion impossible.
Before 2024, students received three scaled scores, all on the 1.0 to 9.0 scale: one for Paper 1, one for Paper 2, and one overall.
Score conversion data used to be released for each of these three scores, so students could easily see the number of raw correct answers needed to achieve each scaled score.
Score Conversion 2023
For the most recent published year, 2023, the score conversion for each paper was as follows:
| Paper 1 Raw Score | Paper 1 Grade | Paper 2 Raw Score | Paper 2 Grade |
|---|---|---|---|
| 0 | 1 | 0 | 1 |
| 1 | 1 | 1 | 1 |
| 2 | 1 | 2 | 1 |
| 3 | 1 | 3 | 1.2 |
| 4 | 1.9 | 4 | 2.2 |
| 5 | 2.7 | 5 | 3 |
| 6 | 3.4 | 6 | 3.7 |
| 7 | 4 | 7 | 4.4 |
| 8 | 4.6 | 8 | 5 |
| 9 | 5.2 | 9 | 5.6 |
| 10 | 5.8 | 10 | 6.1 |
| 11 | 6.3 | 11 | 6.5 |
| 12 | 6.6 | 12 | 6.7 |
| 13 | 6.9 | 13 | 7 |
| 14 | 7.1 | 14 | 7.2 |
| 15 | 7.3 | 15 | 7.4 |
| 16 | 7.6 | 16 | 7.7 |
| 17 | 7.9 | 17 | 8 |
| 18 | 8.3 | 18 | 8.4 |
| 19 | 9 | 19 | 9 |
| 20 | 9 | 20 | 9 |
We can tell from this that this year, Paper 2 was generally slightly harder than Paper 1, as students needed fewer correct answers in Paper 2 to get an equivalent scaled score. For instance, 9/20 would equate to 5.2 on Paper 1 and 5.6 on Paper 2.
For the TMUA overall, the score conversion was:
| Overall Raw Score | Overall Grade |
|---|---|
| 0 | 1 |
| 1 | 1 |
| 2 | 1 |
| 3 | 1 |
| 4 | 1 |
| 5 | 1 |
| 6 | 1.5 |
| 7 | 1.9 |
| 8 | 2.4 |
| 9 | 2.8 |
| 10 | 3.2 |
| 11 | 3.5 |
| 12 | 3.9 |
| 13 | 4.2 |
| 14 | 4.5 |
| 15 | 4.8 |
| 16 | 5.1 |
| 17 | 5.4 |
| 18 | 5.7 |
| 19 | 6 |
| 20 | 6.2 |
| 21 | 6.5 |
| 22 | 6.6 |
| 23 | 6.7 |
| 24 | 6.8 |
| 25 | 6.9 |
| 26 | 7 |
| 27 | 7.1 |
| 28 | 7.2 |
| 29 | 7.3 |
| 30 | 7.4 |
| 31 | 7.6 |
| 32 | 7.7 |
| 33 | 7.8 |
| 34 | 8 |
| 35 | 8.2 |
| 36 | 8.4 |
| 37 | 8.6 |
| 38 | 9 |
| 39 | 9 |
| 40 | 9 |
Any scores of 38 or above would equate to a perfect scaled score of 9.0 – so you could afford to get two questions wrong and still get a 9.0. 26/40 equated to 7.0 and 14/40 to 4.5. Getting 5/40 or less equated to the lowest possible score of 1.0.
Note: the scaling system has changed since 2023, with average marks slightly lower under the new system. In addition, score conversions for the TMUA varied from year to year under the old system, so no direct comparisons between the 2023 data and the current TMUA can be drawn.
However, this information may be useful as a very rough guide to the raw number of correct answers needed to achieve each scaled score in the TMUA.
TMUA Grade Boundaries
Many students ask what the TMUA grade boundaries are. Unfortunately, there are no grade boundaries in the traditional sense for the TMUA. That is, there is no set number of raw marks which equates to a specific scaled score.
This relates to a theme which we’ve touched on a number of times in this guide – the fact that, since 2024, TMUA scaled scores have been calculated using a statistical method called the Rasch item-response model. This adjusts each student’s score based on the difficulty of questions they had to answer. In other words, getting a trickier question right will increase your scaled score more than getting an easier question right.
Grade Boundaries 2023
The last time the TMUA used a more straightforward conversion method was in 2023. For this year, we can approximate the TMUA grade boundaries based on the table in the previous section of this guide.
| Scaled Score | Raw Score |
|---|---|
| 1.0 | 0 |
| 1.5 | 6 |
| 2.0 | 8 |
| 2.5 | 9 |
| 3.0 | 10 |
| 3.5 | 11 |
| 4.0 | 13 |
| 4.5 | 14 |
| 5.0 | 16 |
| 5.5 | 18 |
| 6.0 | 19 |
| 6.5 | 21 |
| 7.0 | 26 |
| 7.5 | 31 |
| 8.0 | 34 |
| 8.5 | 37 |
| 9.0 | 38 |

Take Our TMUA Practice Papers
Preparing for the TMUA? Take our practice paper today!
Can we infer anything from these grade boundaries about how many raw marks will be required to achieve a certain scaled score in the TMUA in 2026?
Because the scoring system has changed, we can’t make direct comparisons. When the new system came into being in 2024, the average score decreased by around 0.3 points. You can use this information to make a very rough estimate of how scaling might work in 2026. However, as noted above, the difficulty of questions you get right also affects your score, as well as just the number of correct answers you give.
What is a Good TMUA Score?
A good TMUA score will depend on the universities and courses to which you are applying. A good score, in short, is one which enhances your application rather than acts as a drag on it.
Among all test takers in the 2025-26 application cycle, the average TMUA score (median) was approximately 3.87. This compares to 4.0 in the 2024-25 cycle. Anything above this score will place you in the top half of test-takers.
The threshold for coming in the top 25% was 5.2 in 2025-26 and 2024-25, and to come in the top 10%, you needed to score 6.5 in 2024-25 and 6.38 in 2025-26.
For Cambridge
The stats we just gave relate to TMUA scores from both the October and January test sittings. But as we mentioned earlier, performance in the January sitting is weaker on average, as Cambridge applicants have to take the test in October.
That means you will need to score higher than the overall TMUA average to stand out compared to other Cambridge applicants. In the October sitting, TMUA set the scaled scores so that:
- 4.5 is the 50th percentile
- 7.0 is the 90th percentile
And in October 2024, 5.7 was the 75th percentile (i.e. only 25% of test-takers scored higher than 5.7).
According to Cambridge’s official admissions statistics, the average TMUA score of applicants and offer-holders at Cambridge in 2025 was as follows:
- Applicant average score = 4.57
- Offer-holder average score = 6.31
A good TMUA score for Cambridge would be anywhere above the average offer-holder score of 6.31. This would mean your TMUA performance was among the very strongest for Cambridge applicants.
For LSE
In 2024, LSE released the average TMUA scores for applicants and offer-holders for its Economics BSc:
- Applicant average score = 7.1
- Offer-holder average score = 7.4
These are very high scores, in the top 5-7% of all test-takers. Note that this is only one course and is among LSE’s most popular and competitive. However, it does serve as an indication of the very high level of performance required for acceptance.
For Imperial
Imperial’s official admissions data shows the average TMUA scores of applicants by department and outcome for 2026:
| Department | Offer-holder | Unsuccessful – interviewed | Unsuccessful – not interviewed |
|---|---|---|---|
| Business School | 5.3 | 5.0 | 3.2 |
| Computing | 6.2 | n/a | 3.7 |
| Join Maths and Computing | 7.5 | n/a | 4.6 |
| Mathematics | 7.6 | n/a | 4.7 |
| Average | 6.7 | 4.1 |
On average, the score of an accepted applicant at Imperial is 6.7 and an unsuccessful one is 4.1. There is significant variation between departments, though, with the average offer-holder for the Mathematics department scoring 7.5 (in the top 5% of all test-takers) vs 5.3 for the Business School.
A good TMUA score for Imperial will depend on what department you are applying to. Aim for 5.3 if you’re applying to the Business School and 7.5 for Mathematics.
For Oxford
Oxford has announced that it will be using the TMUA for Maths and Computer Science-related courses for 2027 entry (i.e. from October 2026).
Because there is no data yet for candidates who taken the test, we don’t know the average scores for accepted vs rejected students.
However, it is reasonable to assume that a good TMUA score for Oxford will be similar to the other top universities that use this test. A score above 7.0 will place you in the top 10% of all test-takers in the October sitting. Given that Oxford’s STEM courses tend to have acceptance rates around 10%, a score around this mark will be needed to prevent your performance harming your application.
Remember that Oxford will use the TMUA alongside other aspects of your application, including your grades, personal statement, and interview.
Get a TMUA Tutor
Dukes Plus offers the highest standards of Oxbridge admissions test support for students preparing for their applications, including TMUA tutoring.
Our packages of 1-1 teaching from subject-specialist, Oxbridge-graduate tutors are designed to enhance your performance – whatever your current level of preparation. Our students improve their scores by 20% on average after just four hours’ tutoring.
Book a TMUA tutor today to enhance your preparation.
FAQs
A good TMUA score depends on the university and course you are applying for. Across all test-takers in the 2025-26 cycle, the median score was approximately 3.87, so anything above this puts you in the top half of candidates.
A score of 5.2 placed candidates in the top 25%, while a score of around 6.4–6.5 placed them in the top 10%. For the most competitive universities and courses, such as Cambridge, LSE Economics, Imperial Mathematics, and Oxford Maths or Computer Science-related courses, a score above 6.5 or 7.0 is likely to be considered strong.
Not necessarily. A TMUA score of 9.0 is the highest possible scaled score, but it does not always mean you answered every question correctly.
Before the scoring system changed in 2024, students could sometimes achieve a 9.0 without full raw marks. For example, in 2023, an overall raw score of 38/40 or above converted to a scaled score of 9.0. Since 2024, there has been no simple raw mark conversion table, because scores are adjusted according to question difficulty using the Rasch item-response model.
Yes, 6.5 is a good TMUA score. In the 2024-25 cycle, a score of 6.5 placed candidates around the 90th percentile overall, meaning only about 10% of test-takers scored higher.
However, competitive applicants for top universities will also be scoring around 6.5 or above. For instance, accepted applicants to Maths courses at Imperial College London scored 7.6 on average in 2026.
TMUA scores range from 1.0 to 9.0, with 1.0 being the lowest possible scaled score and 9.0 being the highest.
The TMUA consists of two papers, each with 20 multiple-choice questions. Your raw score is based on the number of correct answers you give, with no penalty for wrong answers. This raw performance is then converted into the 1.0 to 9.0 scaled score.
A score of 5.0 is above average and is close to the top quarter of test-takers. In the 2025-26 cycle, the median score was approximately 3.87, while the threshold for the top 25% was 5.2.
This means that a 5.0 is a solid score, but it may not be enough on its own for the most competitive courses. For universities such as Cambridge, Imperial, LSE, and Oxford, applicants will often need to aim higher, especially for Maths, Economics, Computer Science, and related courses.
There is no fixed TMUA score that guarantees an offer, as universities consider the TMUA alongside the rest of your application. However, the available data gives a useful indication of what competitive scores look like.
- Cambridge: the average offer-holder score in 2025 was 6.31, so a score above this would be strong.
- LSE: for the Economics BSc, the average offer-holder score was 7.4 in 2024
- Imperial: the average offer-holder score varies by department. Business School offer-holders averaged 5.3, Computing offer-holders averaged 6.2, Joint Maths and Computing offer-holders averaged 7.5, and Mathematics offer-holders averaged 7.6.
- Oxford: there is not yet admissions data yet as the TMUA is a new requirement. However, for Maths and Computer Science-related courses, a score around 7.0 or above is likely to be a strong benchmark, as this places candidates in the top 10% in the October sitting.

Author
Louis Scott , Education Content Writer